Thumbnail pencil sketch, exploring a possible arrangement of autoimmune disease variables.
Body part categories on left, with color-coded lines connecting  to autoimmune disorders listed on the right.
Thumbnail view of final magazine spread. Graphic presents information about 76 autoimmune diseases including main body part affected and frequency in population.

Autoimmune Disorders

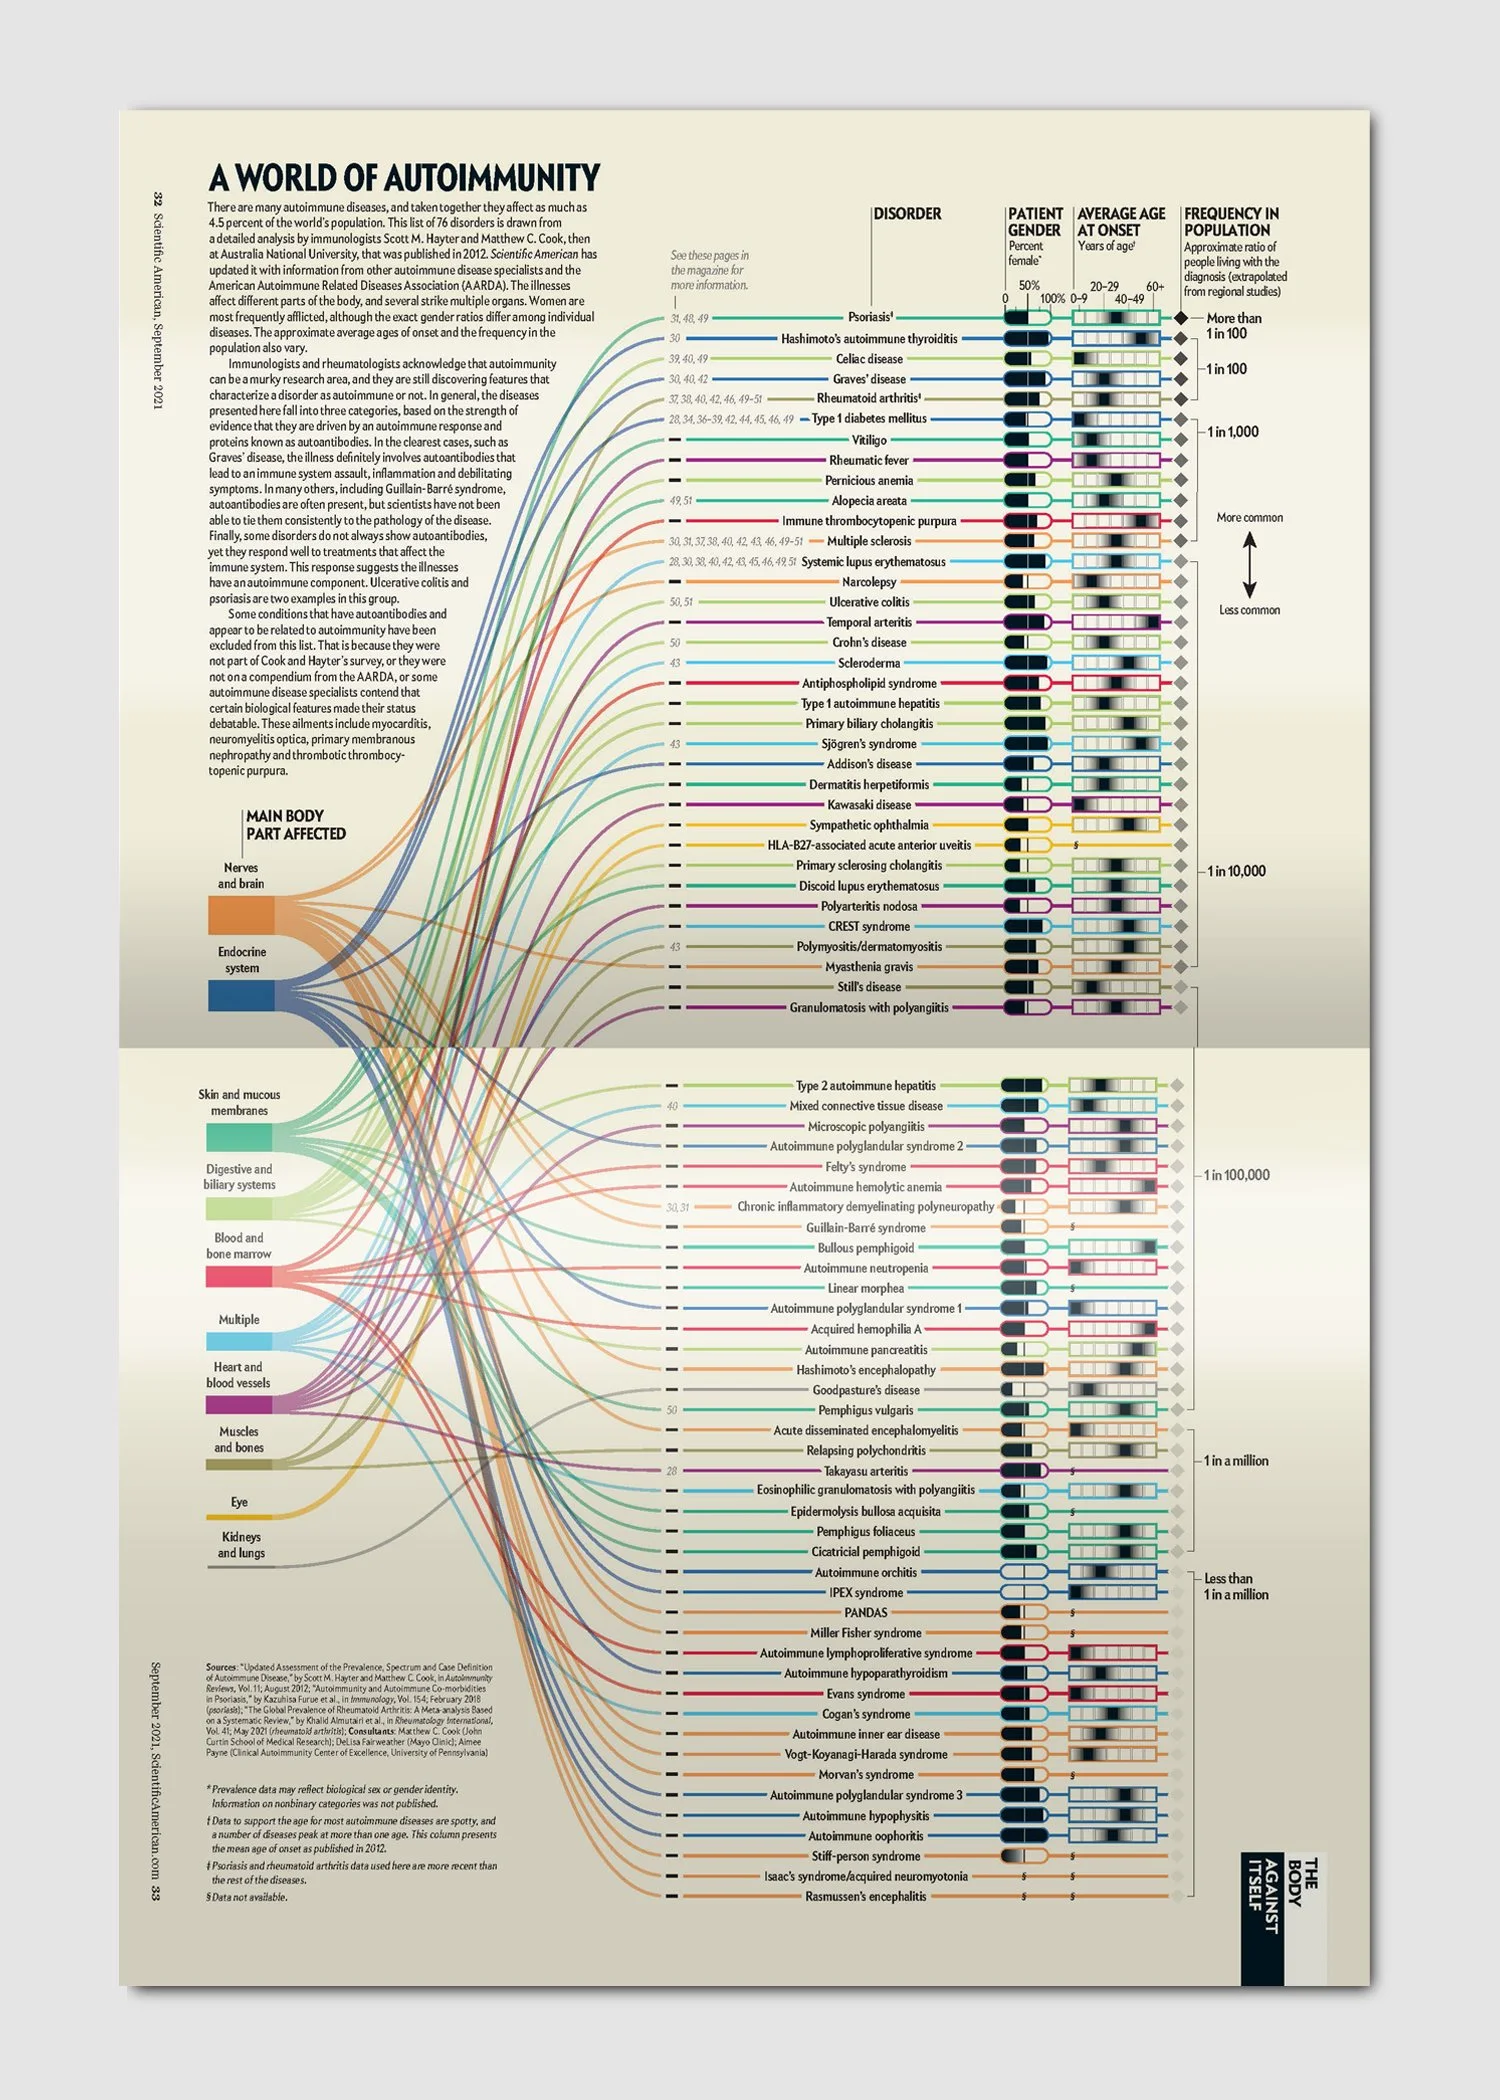
This graphic—from a September 2021 Scientific American special report on the topic—shows prevalence, average age of onset, body parts affected, and gender ratio for 76 disorders.

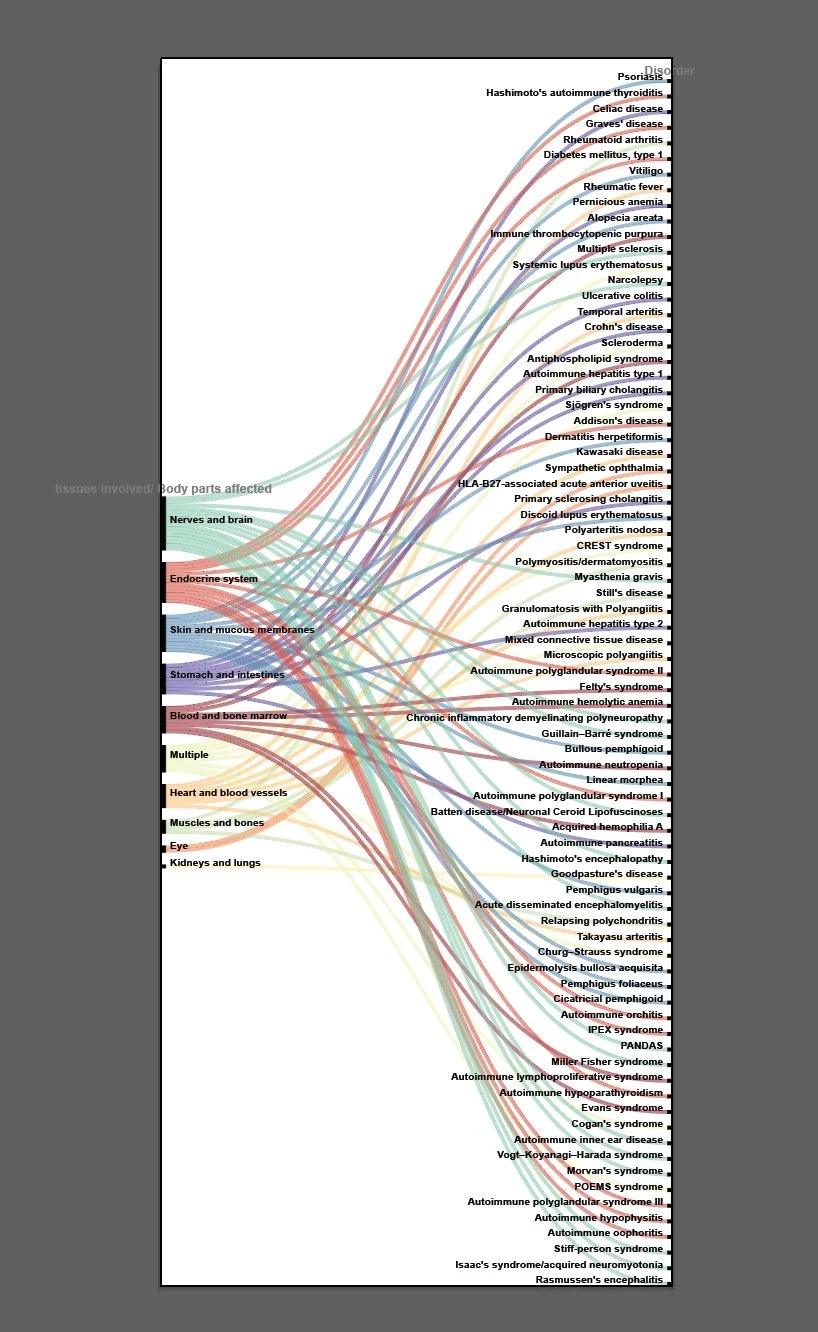
Top to bottom; concept sketch, initial alluvial diagram experiment with RAWGraphs https://www.rawgraphs.io/, and the final graphic.

For more context, read the full article at Scientific American. https://www.scientificamerican.com/article/the-terrible-toll-of-76-autoimmune-diseases/

Graphic by Jen Christiansen, research by Miriam Quick, text by Maddie Bender, and text editing by Josh Fischman.

Previous
Previous

Language of Science

Next
Next

COVID's Uneven Toll