Appearances
Scroll down for a list of appearances, including some podcast and video links.
I've also had great fun collaborating on vertical videos with colleagues. Especially a Scientific American TikTok about my favorite pulsar chart. (Thanks to Carin Leong and Kelso Harper for coaching, script editing, and production.) See more of my own TikTok videos at https://www.tiktok.com/@christiansenjen
July 2026 • Presenter • The Art of Planning and Editing Graphics • Association of Medical Illustrators annual conference • Madison, Wisconsin
March 2026 • Guest speaker (virtual) • Naila Moreira and Ben Baumer’s Data Journalism class • Smith College
January 2026 • Presenter and participant • Telling Math Stories With Graphics • Rigorous Illustrations: Their creation and evaluation for mathematical research (Part of the Illustration as a Mathematical Research Technique series) • hosted by Institut Henri Poincaré, Paris
September 2025 • Presenter • Science Graphics webinar • hosted by Curtin University
August 2025 • Workshop Facilitator (virtual) • Developing Data Visualizations with Different Audiences in Mind (hands-on sketching session) • Talking Maths in Public
July 2025 • Discussion Leader • Data in an Era of Misinformation • Visualization in Science and Education (Gordon Research Conference)
June 2025 • Presenter • Visualizing Knowledge 2025 • Visualizing Resilience: Lessons from the Natural World • Aalto University, Finland
March 2025 • Guest speaker (virtual) • Mark Hansen’s Data Visualization Seminar • Columbia University
March 2025 • Presenter • Columbia Scholastic Press Association Annual Spring Convention • Columbia University
November 2024 • Podcast guest • Consider This Next Episode 7 (visual science communication) • with host Kacie Luaders for the Civic Science Media Lab
November 2024 • Presenter • Science Graphics webinar • hosted by PRI (The Prairie Research Institute) at the University of Illinois
October 2024 • Panelist (virtual) • ScienceWriters2024 (annual gathering of the National Association of Science Writers) • “When Words Aren’t Enough: How to make visuals part of your storytelling” panel discussion with Beth Rakouskas (Creative Director, Science) and Rachel Ehrenberg (Senior Associate Editor, Knowable Magazine)
October 2024 • Presenter • Science Graphics webinar • hosted by EASE (The European Association of Science Editors)
May 2024 • Presenter • Science Graphics webinar • hosted by the European Geoscience Union
May 2024 • Panelist (virtual) • Post-baccalaureate Science Illustration Certificate Program • California State University, Monterey Bay
April 2024 • Presenter (virtual) • Visualization Interest Group • The Alan Turing Institute
March 2024 • Guest speaker• Information Design & Data Visualization MS and MFA programs • Northeastern University
February 2024 • Guest speaker (recorded interview with Kyle Valentic)• Design Fundamentals class • UCLA
December 2023 • Podcast guest • Hablemos de Infografía, T4 Episodio 2 • Infografía a ciencia cierta con Jen Christiansen • with host Raúl Rodríguez
December 7, 2023 • Panelist (virtual) • AstroViz Community Meetup • Panel discussion on Visual Storytelling with Kalina Borkiewicz (Director, NCSA Visualization), Brian Tatosky (VFX Supervisor, Star Trek, CBS Studios) and Jen Christiansen (Senior Graphics Editor, Scientific American), moderated by Ryan Wyatt (Senior Director of Morrison Planetarium and Science Visualization, California Academy of Sciences)
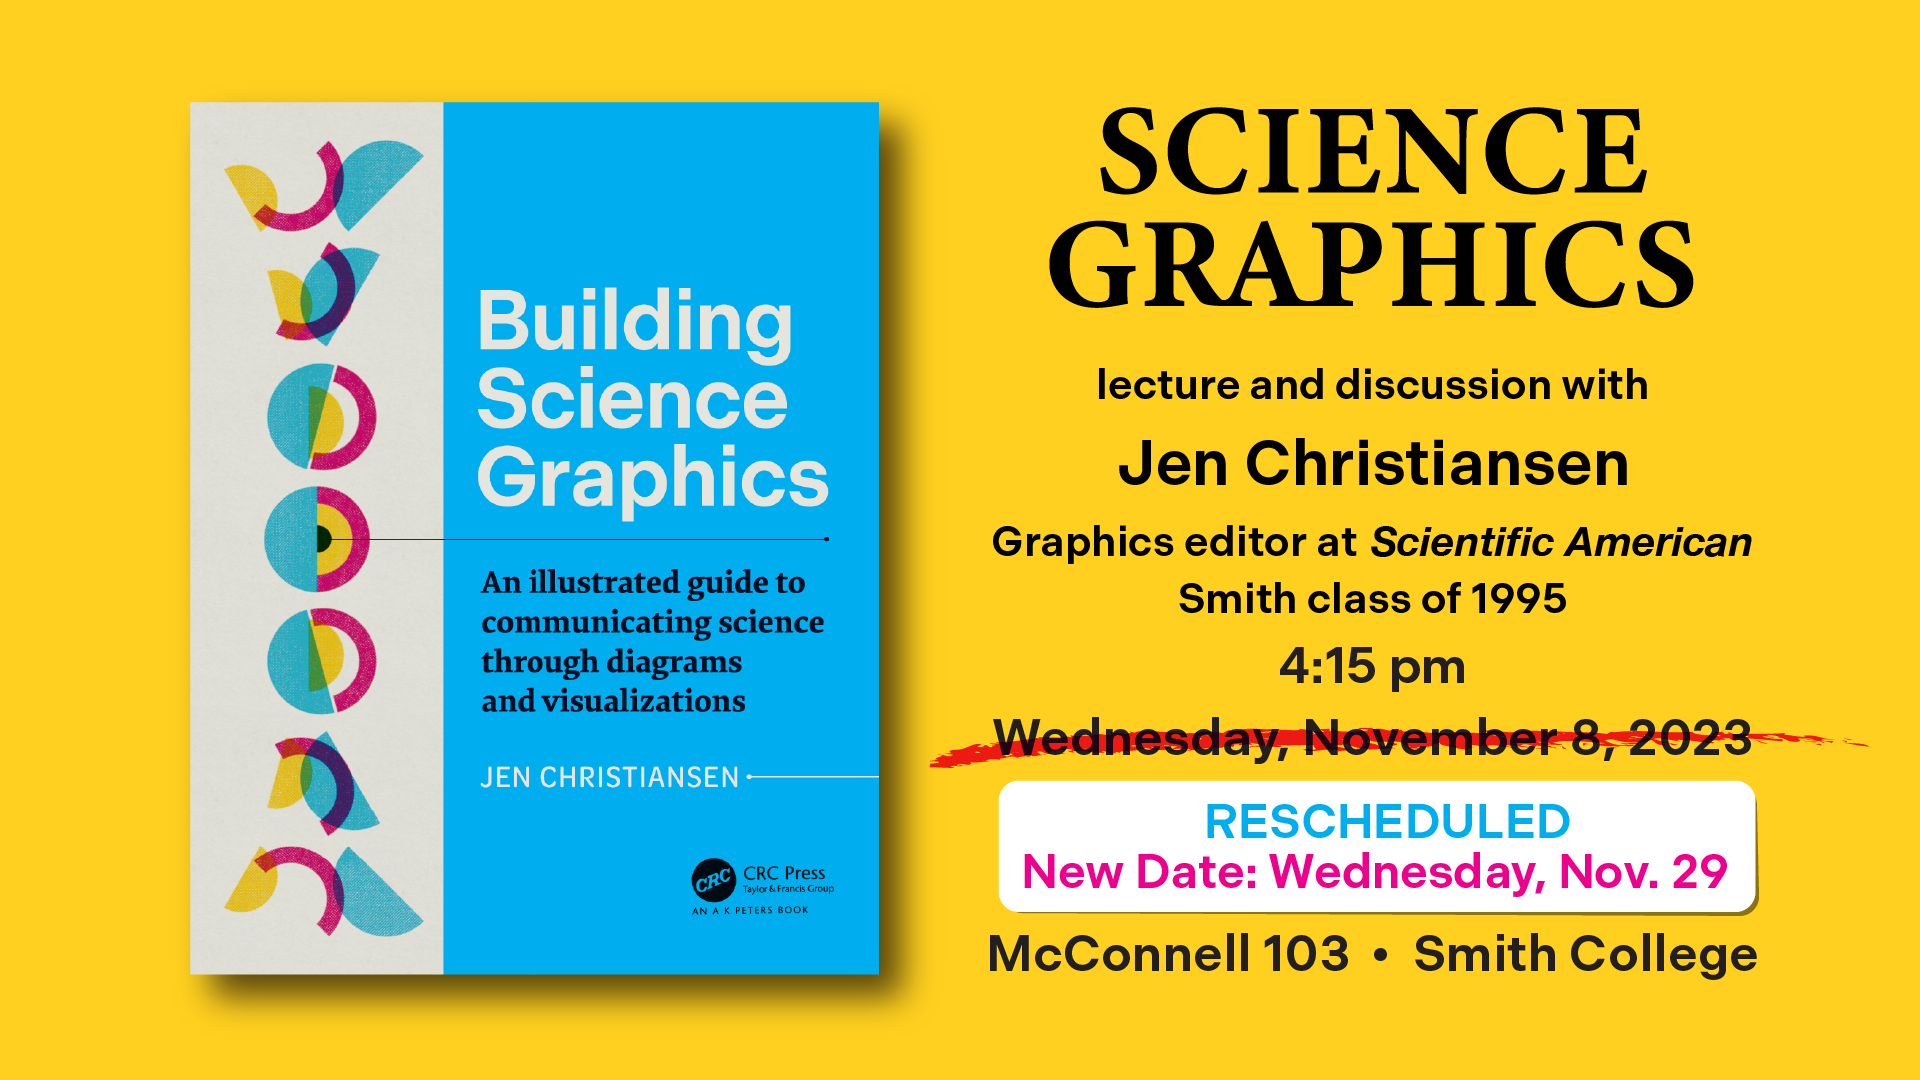
November 2023 • Presenter • Science Graphics • Smith College
November 2023 • Guest speaker • Department of art/art history • Representing Animals colloquium • Smith College
October 2023 • Presenter • Science visuals retreat • American Association for the Advancement of Science (AAAS)
October 2023 • Presenter • Visual Media Webinar Series • hosted by the LTER Graduate Student’s Event & Initiatives Committee
September 2023 • Presenter • Special Considerations for Science Graphics (from a journalist's point of view) • Universität Wien
August 2023 • Presenter • Visualizing Complexity Science Workshop speaker • Complexity Science Hub Vienna
July 2023 • Presenter • Visualization in Science and Education (Gordon Research Conference)
May 2023 • Podcast guest • Data Viz Today episode 85 • How to transform science into clear and welcoming graphics, with Jen Christiansen • with host Alli Torban
April 2023 • Presenter • Special Considerations for Science Graphics • Lectures in Data Visualization • Series presented by the Brown Institute at Columbia Journalism School
April 2023 • Guest speaker (virtual) • Jennifer Frazier’s Science Communication Minicourse • University of California San Fransisco
March 2023 • Podcast guest • PolicyViz Podcast episode 235 • with host Jonathan Schwabish
March 2023 • Guest speaker (virtual) • Contemporary Issues in Bioethics: Communicating Science and Bioethics class • Duke University
February 2023 • Podcast guest • The Data Journalism Podcast — The Science of Dataviz• with hosts Alberto Cairo and Simon Rogers
February 2023 • Podcast guest • Shifting Schools, episode 254 • Why Art and Science go Hand in Hand• with hosts Tricia Friedman and Jeff Utecht
February 2023 • Guest speaker (virtual) • Earthjustice
January 2023 • SciCommers Mentor Chat guest (virtual) • Boston University College of Communication
January 2023 • Videocast Episode 3: Building Science Graphics with Jen Christiansen • A conversation hosted by AK Peter Visualization Series (Routledge/CRC) co-editors Alberto Cairo and Tamara Munzner
November 2022 • Guest speaker • Visualizing Science: Persuasive Storytelling (webinar) • Hosted by the Office of Communications and Public Affairs • Columbia University
November 2022 • Guest speaker (virtual) • Visual communication and design seminar series • Northwestern University
October 2022 • Guest speaker (virtual) • Mark Hansen’s Communicating Data and Statistics class • Columbia University
September 2022 • Speaker/workshop leader (virtual) • Special Considerations for Science Graphics • Beautiful Data workshop series • presented by Graphic Hunters
September 2022 • Guest speaker (virtual) • Stranded in Science (scicomm/sciart seminar series) • SUNY Albany
May 2022 • Guest speaker (virtual) • Science Communicators of North Carolina
May 2022 • Panelist (virtual) • Post-baccalaureate Science Illustration Certificate Program • California State University, Monterey Bay
May 2022 • Guest speaker (virtual) • Data Analytics & Visualization Expert Speaker Series in the Open Studies graduate program • Maryland Institute College of Art
March 2022 • Guest speaker (virtual) • Alberto Cairo’s Introduction to Infographics and Data Visualization class • University of Miami
October 2021 • Panelist (virtual) • Building Bridges between Research and Practice, a conversation with Steven Franconeri and Jen Christiansen, moderated by Jon Schwabish • IEEE VIS • Visualization for Communication (VisComm) workshop • For a recording, check out podcast episode 205 of PolicyViz
October 2021 • Guest speaker (virtual) • Molecular Science Graduate Program • Ryerson University
October 2021 • Panel moderator • Drawing Unseeable Science • Scientific American Live webinar for all-access subscribers
September 2021 • Presenter (virtual) • Illustrating Complex Science Stories • Science Journalism Forum
July 2021 • Presenter (virtual) • Telling Stories With—and About—Graphics • Festival Comunicação Científica
May 2021 • Panelist (virtual) • Post-baccalaureate Science Illustration Certificate Program • California State University, Monterey Bay
April 2021 • Presenter (virtual) • NightSchool: Illustrating Science (A virtual edition of NightLife) • Hosted by Kristina Fong and Lin Kung • California Academy of Sciences
April 2021 • Guest on scientific visualization module of Data Visualization: A Lesson and Listen Series hosted by Bill Shander • Linkedin Learning
March 2021 • Workshop moderator • Visualizing your Science: Developing explanatory graphics with different audiences in mind (hands-on sketching session, virtual) • ComSciCon-Atlanta
March 2021 • Guest speaker (virtual) • Mark Hansen’s Communicating Data and Statistics class • Columbia University
February 2021 • One Chart at a Time contributor (Episode 29: Ridgeline Charts) • Graphic literacy video series hosted by Jon Schwabish
February 2021 (in-person event originally planned for March 2020, rescheduled as a virtual gathering) • Panelist (Communicating Uncertainty) • Computation + Journalism Symposium 2021
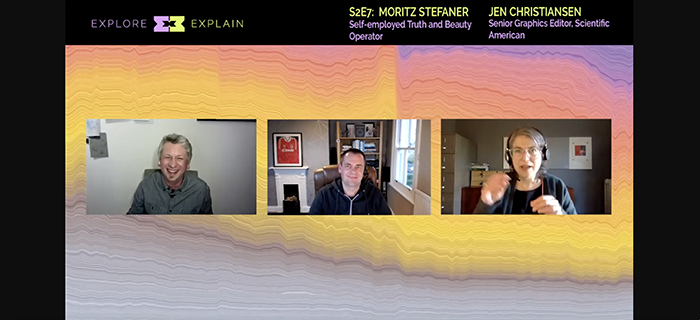
December 2020 • A detailed conversation with Moritz Stefaner and Andy Kirk about the data, editorial, and design story behind a combined print and interactive visualization project exploring 175 years of word usage patterns in Scientific American • Explore Explain (season 2, episode 7) • hosted by Andy Kirk
June 2020 • Presenter (virtual) • Visualizing Science: Illustration and Beyond • in conjunction with the museum’s annual Art of Nature exhibit • Santa Cruz Museum of Natural History • hosted by Marisa Gomez
March 2020 • Guest speaker • Daniel Vahaba’s Science in the Public Eye seminar • Smith College
March 2020 • Workshop speaker • Visualizing Science: Create Visuals That Have Impact • Hosted by the Office of Communications and Public Affairs • Columbia University
December 2019 • Podcast guest • Data Stories episode 152 • Year in Review 2019 • Columbia University with hosts Moritz Stefaner and Enrico Bertini
October 2019 • Guest speaker (virtual)• Alberto Cairo’s Data Visualization Studio course • University of Miami School of Communication
October 2019 • Guest speaker • Department of Mathematics • University of Mary Washington
August 2019 • Guest speaker • Los Alamos National Laboratory
July 2019 • Guest speaker • Yale University Summer Program in Astrophysics
May 2019 • Graduation ceremony speaker • M.S. Data Visualization • Parsons School of Design
April 2019 • Panelist • Journalism & Design: A Mini-Conference • Columbia Journalism School
March 2019 • Presenter • The Experiential Storytelling Conference: Interdisciplinary Narratives in Art, Design, Science and Entrepreneurship • Rowan University
March 2019 • Guest speaker • mindCORE Technical Workshop: Visual Communication of Science • University of Pennsylvania
March 2019 • Guest speaker and workshop facilitator • William Pierson Field Lecture, Keller Center • Princeton University
February 2019 • Podcast guest • Storytelling with Data, episode 14 • Learning Dataviz • with host Cole Nussbaumer Knaflic
January 2019 • Panelist (Mentorship Component: Visuals, Audio and Action: Multimedia and the Art of Communicating Science) • Gordon Research Seminar: Complex Active and Adaptive Material Systems
July 2018 • Presenter (Visualizing Science: Illustration and Beyond) • Guild of Natural Science Illustrators annual conference
July 2018 • Panelist • 2018 Big Data Analytics Conference: Data Visualisation • Cancer Research U.K.
April 2018 • Speaker and workshop facilitator • An Infographer’s Journey through Time and Technology • New Paltz Design Week • State University of New York
September 2017 • Panelist and speaker • Creating Visuals that Maximize Research Impact workshop • Louisiana State University, College of Science
August 2017 • Section moderator (Visualizing Big Data to Support Decision-Making by General Audiences) and poster presenter (Visualizing Uncertainty) • Gordon Research Conference: Visualization in Science and Education
March 2017 • Panelist and workshop co-facilitator (with Alberto Cairo and Mark Hansen) • Visualizing and Understanding Uncertainty • Investigative Reporters and Editors, NICAR Conference
November 2016, 2017, 2018, 2019 • Co-founder and co-organizer • SciVizNYC • A conference that brings NYC-area visual science communicators, researchers, journalists, artists, and enthusiasts together for an event focused on visualizing science for analysis, education, inspiration, and provocation
September 2016 • Presenter • Tieto näkyväksi (Visualizing Knowledge) • Helsinki, Finland
August 2016 • Presenter and panelist • Broadening Participation in Visualization (BPViz): Bridging Science, Technology, and the Arts Through Visualization • Purdue University and The University of Illinois at Urbana-Champaign
July 2016 • Podcast guest • PolicyViz episode 53 • with host Jonathan Schwabish
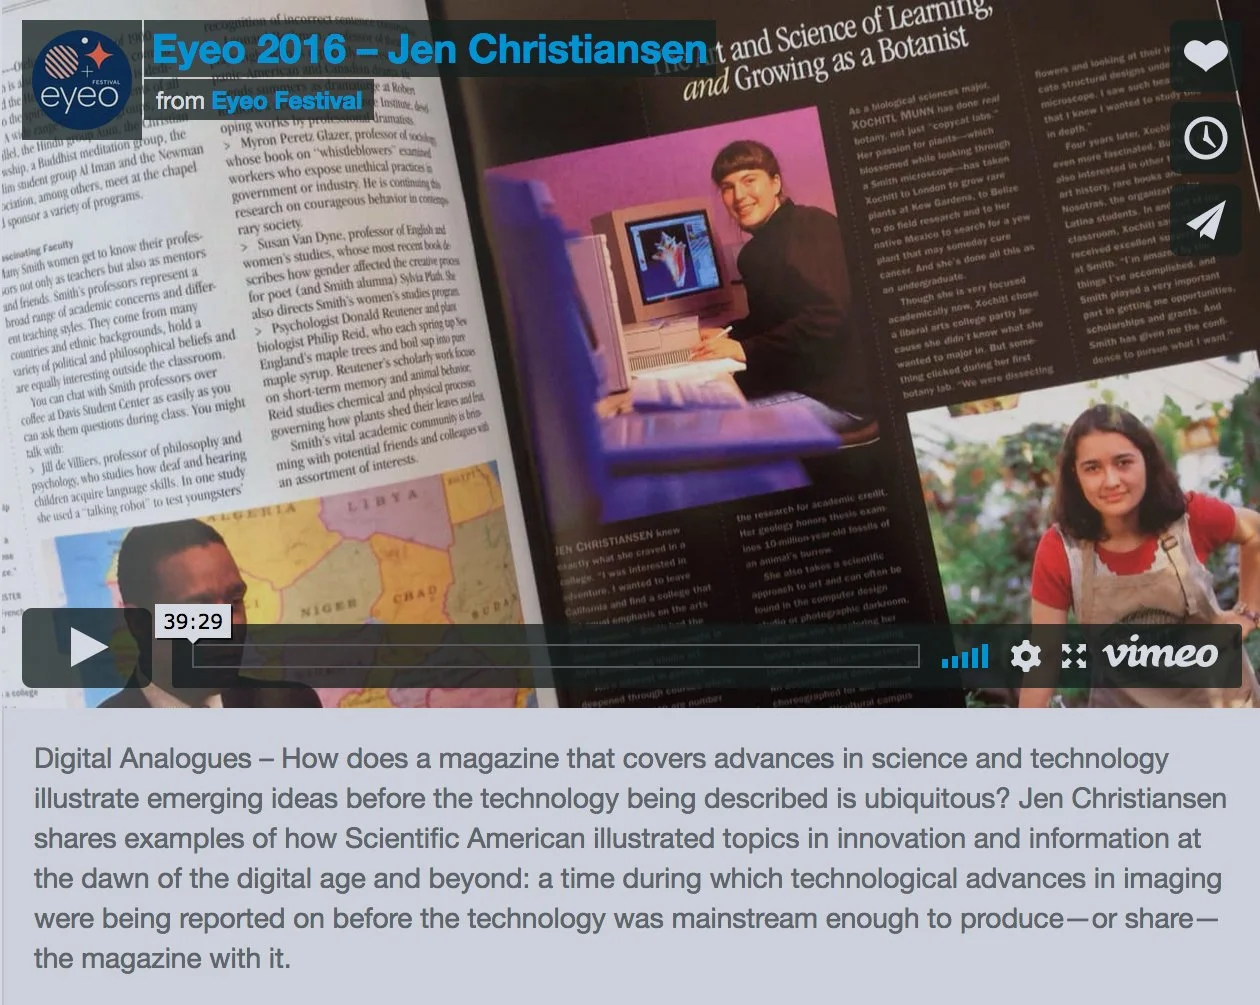
July 2016 • Presenter • Digital Analogues • Eyeo Festival
February 2016 • Presenter • Illustrating Science for a Non-Specialist Audience and workshop co-facilitator (with Paul Blickle) • QVED & QVIG Editorial Design Conference • Munich, Germany
November 2015 • Presenter (What is data visualization, and how, when, and why do we do it at Scientific American?) and workshop moderator • Data to Decisions Visualization Workshop • Alaska NSF EPSCoR
October 2015 • Panelist (Visualization in the Real World: Assembling Teams and Systems to Create Visualization-Centric Solutions) • IEEE VIS
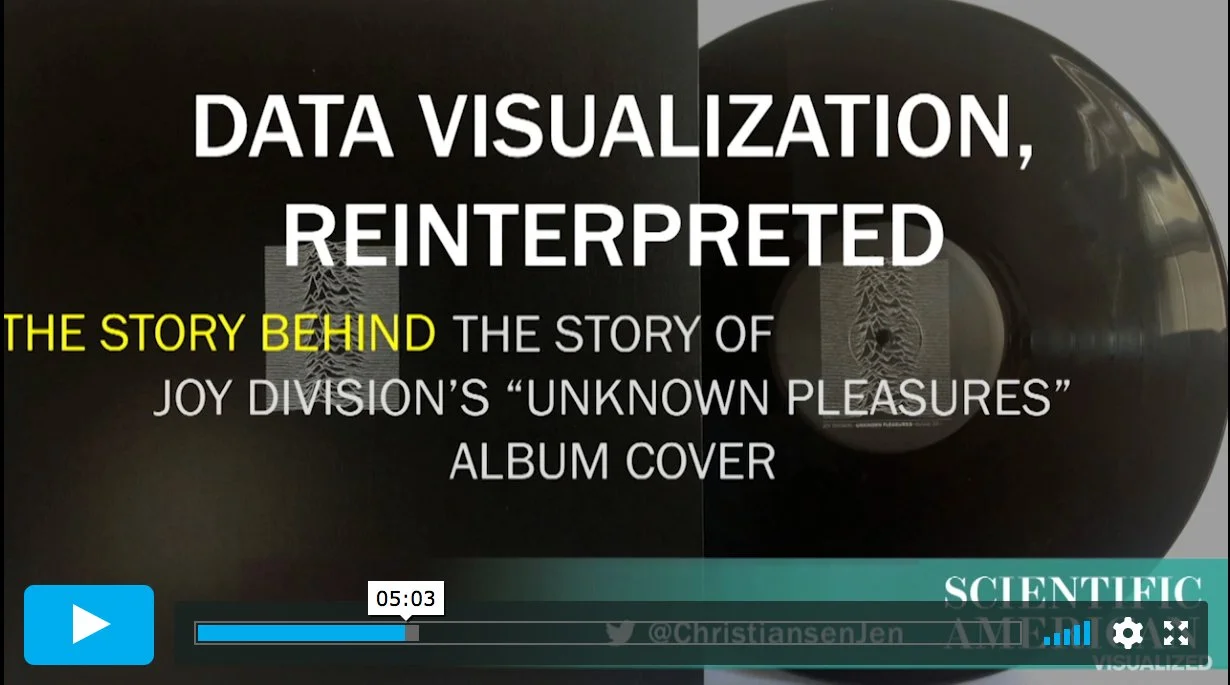
October 2015 • Presenter • The Story Behind the Story of Joy Division’s “Unknown Pleasures” Album Cover • Visualized • NYC
August 2015 • Presenter • “The Value of Artistic License in Illustrating Scientific Concepts for a Non-Specialist Audience” • Gordon Research Conference: Visualization in Science and Education
February 2015 • Podcast guest • Data Stories episode 52 • Science Communication at Scientific American with Jen Christiansen • with hosts Moritz Stefaner and Enrico Bertini
July 2014 • Presenter • Association of Medical Illustrators annual conference • Mayo Clinic
April 2014 • Presenter • Visualizing Science: Developing Information Graphics for Scientific American Magazine • OpenVisConf
October 2013 • Presenter • A Defense of Artistic License in Illustrating Scientific Concepts • Communicating Complexity International Design Conference • Alghero, Italy
October 2013 • Guest speaker • Augsburg University of Applied Sciences • Augsburg, Germany
May 2013 • Presenter • University Research Magazine Association annual conference • Binghamton University
March 2013 • Presenter and juror • Malofiej International Information Graphics Summit • Pamplona, Spain
October 2012 • Guest lecturer • Smith College Geology Department
April 2007 • Presenter • Leaving Traces, Making Marks • Symposium in Honor of H. Allen Curran • Smith College