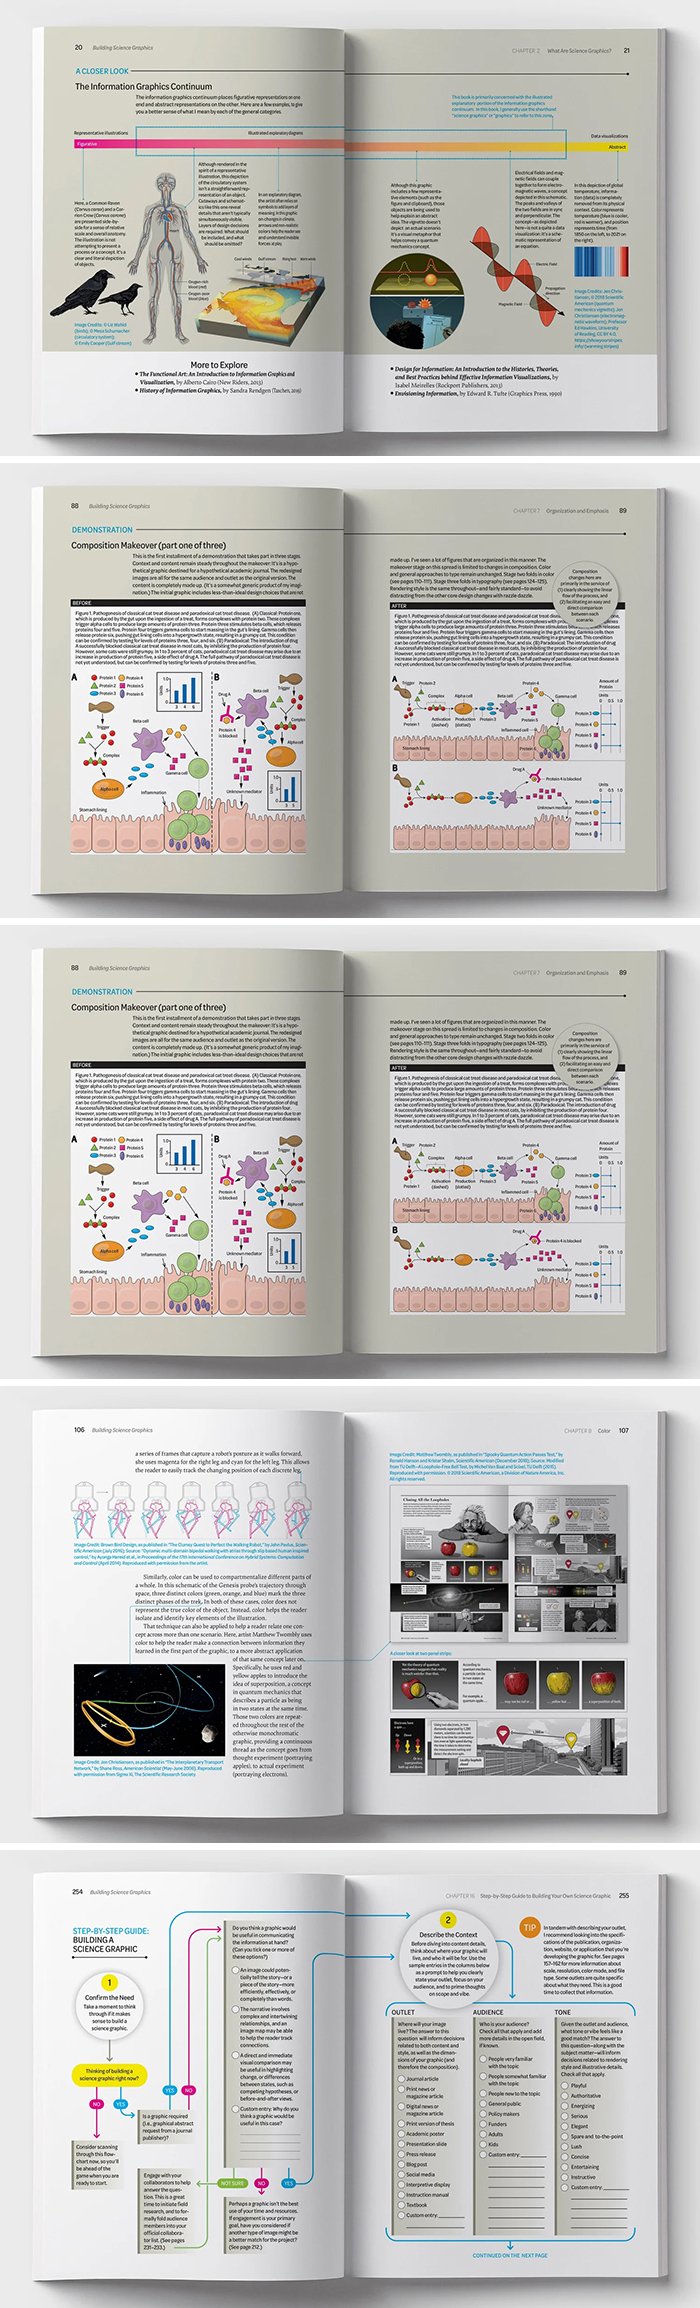
Building Science Graphics: An illustrated guide to communicating science through diagrams and visualizations (published by CRC Press, AK Peters Visualization series) is a practical guide for anyone—regardless of previous design experience and preferred drawing tools—interested in creating scientific illustrated explanatory diagrams. Starting with a clear introduction to the concept of information graphics and their role in contemporary science communication, it then outlines a process for creating graphics using evidence-based design strategies. The heart of the book is composed of two step-by-step graphical worksheets, designed to help jump-start any new project. This is both a textbook and a practical reference for anyone that needs to convey scientific information in an illustrated form for articles, poster presentations, slide shows, press releases, blog posts, social media posts, and beyond.
If you’d like to receive a signed bookplate in the mail, please send the details of your request using the form at this link: https://www.jenchristiansen.com/contact
Cover image by Alli Torban. Typeset in Indivisible and Elena from Process Type Foundry, and Omnes from Darden Studio